Why I Stopped Stressing About “Heat Pump Tariffs” — And Why a Simple Fixed Tariff Turned Out Cheaper
I’ve been running a heat pump for a while now, and like a lot of people, I signed up for one of the special “heat pump tariffs” that suppliers love to promote. In my case, it was the OVO Heat Pump Plus tariff.
It worked fine, and I didn’t think much about it… until OVO announced that they were removing the tariff from 1 February 2026.
That was my catalyst.
Suddenly I had to choose a new tariff, and I realised I didn’t actually understand which one would be cheapest for the way I use electricity.
I’m not an academic. I’m not an energy expert. I’m just a normal person with a heat pump who wants to keep warm without being ripped off. So I decided to stop guessing and actually look at the numbers.
My real 2025 usage (the starting point)
Before comparing tariffs, I needed to know what I actually used.
For 2025, my Glow Bright App and Vaillant heat pump data showed:
- Heat pump usage: 1,817 kWh
- Whole‑house usage: 3,653 kWh
On the OVO Heat Pump tariff, that worked out as:
- 3,653 kWh @ 25p = £913.25
- 1,817 kWh @ 15p = £272.55
- 365 days @ 50p Daily Charge = £182.50
- Total = £1,368.30
That was my baseline.
And honestly, I assumed the other heat‑pump tariffs would be similar or cheaper.
I was wrong.
Heat pumps don’t behave like EVs — and tariffs shouldn’t treat them as if they do
A lot of these tariffs are built around the idea that you can shift big chunks of electricity into cheap windows. That works brilliantly for EV charging or battery storage.
But a heat pump isn’t like that.
A properly set heat pump runs gently and continuously. It doesn’t “charge up” overnight. It doesn’t blast heat in short bursts. It just ticks along, 24 hours a day, keeping the house at a stable temperature.
So if your heat pump is doing what it’s supposed to do, your electricity usage is naturally spread across the whole day — not concentrated into the cheap hours.
That’s the key point that finally made everything click for me.
My actual usage chart (real data, not theory)
This chart shows my real electricity usage for every week of the year, based on my Glow data. You can see that my heat pump was installed in September 2024.
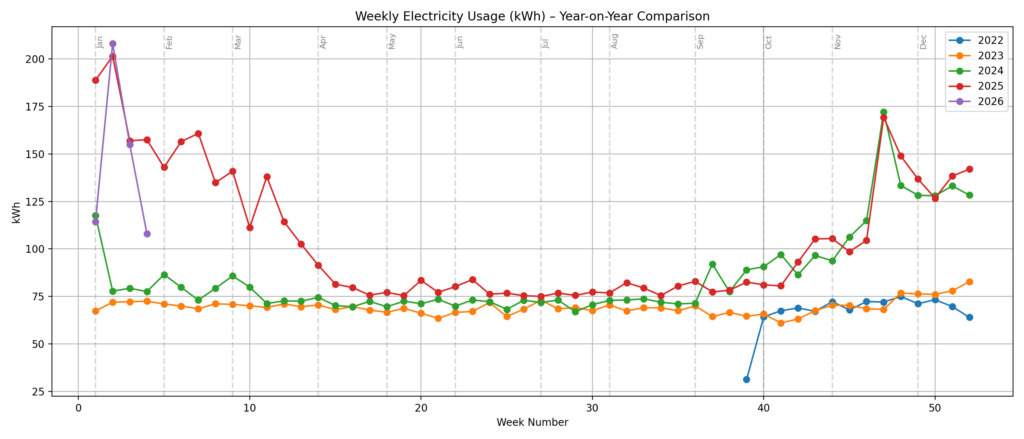
What it shows very clearly is that my usage is steady and predictable. There are no big spikes that would benefit from cheap off‑peak windows, and no big drops that would avoid expensive peak windows. My heat pump just ticks along consistently, week after week — exactly how a heat pump is supposed to run.
Because my usage is spread out like this, I can’t take advantage of the cheap windows in the complicated heat‑pump tariffs. So what really matters for me is the average price per kWh, not the headline off‑peak rate.
If you can’t shift big loads, the fancy tariffs don’t help you
Once I accepted that my heat pump was going to run evenly across the day, I realised something obvious:
What matters isn’t the off‑peak price — it’s the average price.
So I took each tariff and calculated the true 24‑hour weighted average based on the number of hours in each band.
For example, one heat‑pump tariff had:
- 10 hours at ~15.75p
- 14 hours at ~31.5p
- Weighted average: 24.94p/kWh
Then I compared that to a simple fixed tariff:
- Flat rate: 21–22p/kWh
- No peaks
- No penalties
- No time windows
And suddenly the picture became very clear.
My real usage modelled into each tariff’s hourly windows
This is the second chart that really helped me understand what was going on.
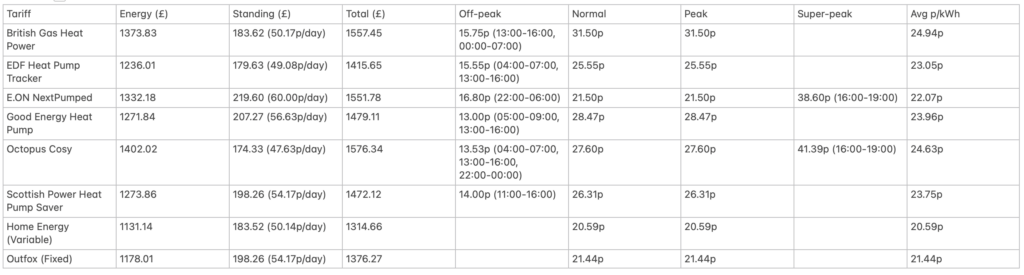
(Heat pumps tariffs comparison tableI – MoneySavingsExpert.com Cheap Energy Club)
This chart (January 2026) takes my real hourly usage and applies each tariff’s time bands to it.
This isn’t guesswork. This isn’t theory. This is literally:
“What would I have paid on this tariff, using my heat pump exactly as I did last year?”
And the results were… eye‑opening.
The fixed tariff beat almost every heat pump tariff
Here’s what I found:
- Many heat‑pump tariffs had average prices in the 23–26p/kWh range
- Some went even higher once super‑peak hours were included
- A good fixed tariff was 21–22p/kWh
- And because my usage is spread evenly, I couldn’t take advantage of the cheap windows anyway
So the fixed tariff wasn’t just simpler — it was cheaper.
Not by pennies.
By £150–£300 per year depending on the tariff.
I decided top go with Outfox which should cost me about £1370 compared to OVO which was £1368.
And I don’t have to:
- change my heating schedule
- micromanage my home
- worry about peak windows
- or risk comfort
I will just… let the heat pump run.
The takeaway (from someone who was just trying to understand this stuff)
If you:
- run your heat pump steadily
- don’t have an EV
- don’t have a home battery
- don’t have big appliances you can shift
- don’t want to micromanage your heating schedule
…then a simple fixed tariff might actually be the cheapest option.
I didn’t expect that.
I certainly didn’t set out to prove it.
I just wanted to know what was genuinely cheapest for my home.
And after modelling a full year of real usage across all the tariffs, the answer was surprisingly straightforward:
A good fixed tariff beat the complicated heat pump tariffs.
No stress.
No time windows.
No super‑peak penalties.
Just a predictable price and a warm house.